Model Calibration
Autumn 2025
What do we mean by model calibration?
- Model calibration is all about ensuring that a model’s predicted probabilities reflect true likelihoods.
What do we mean by model calibration?
Model calibration is all about ensuring that a model’s predicted probabilities reflect true likelihoods.
In other words, a well-calibrated model gives probabilities that match the actual outcomes.
What do we mean by model calibration?
Model calibration is all about ensuring that a model’s predicted probabilities reflect true likelihoods.
In other words, a well-calibrated model gives probabilities that match the actual outcomes.
In summary, if your model says something has a 70% chance of happening, that event should actually happen about 70% of the time over many such predictions.
Example
We have two classifiers:
- Model A: 90% accuracy, 0.91 confidence in each prediction.
- Model B: 90% accuracy, 0.99 confidence in each prediction.
Which is better?
Example
We have two classifiers:
- Model A: 90% accuracy, 0.91 confidence in each prediction.
- Model B: 90% accuracy, 0.99 confidence in each prediction.
Which is better?
Well, Model A is better because if a model is 90% accurate in its prediction(correctly predicting 9 out of 10 samples) then its confidence should be 90% too.
Example
What happen with Model B?
Example
What happen with Model B?
- Model B is overconfident, as its confidence is 99% but the accuracy is 90%
Example
What happen with Model B?
- Model B is overconfident, as its confidence is 99% but the accuracy is 90%
On the other hand, if there was a Model C with an accuracy of 90% and 0.8 confidence in each prediction.
Example
What happen with Model B?
- Model B is overconfident, as its confidence is 99% but the accuracy is 90%
On the other hand, if there was a Model C with an accuracy of 90% and 0.8 confidence in each prediction.
- Model C is underconfident.
Example
By definition, We say that a model is well calibrated when a prediction of a class with confidence p is correct 100p % of the time.
Otherwise, a underconfident and overconfident models are called ill-calibrated.
Example
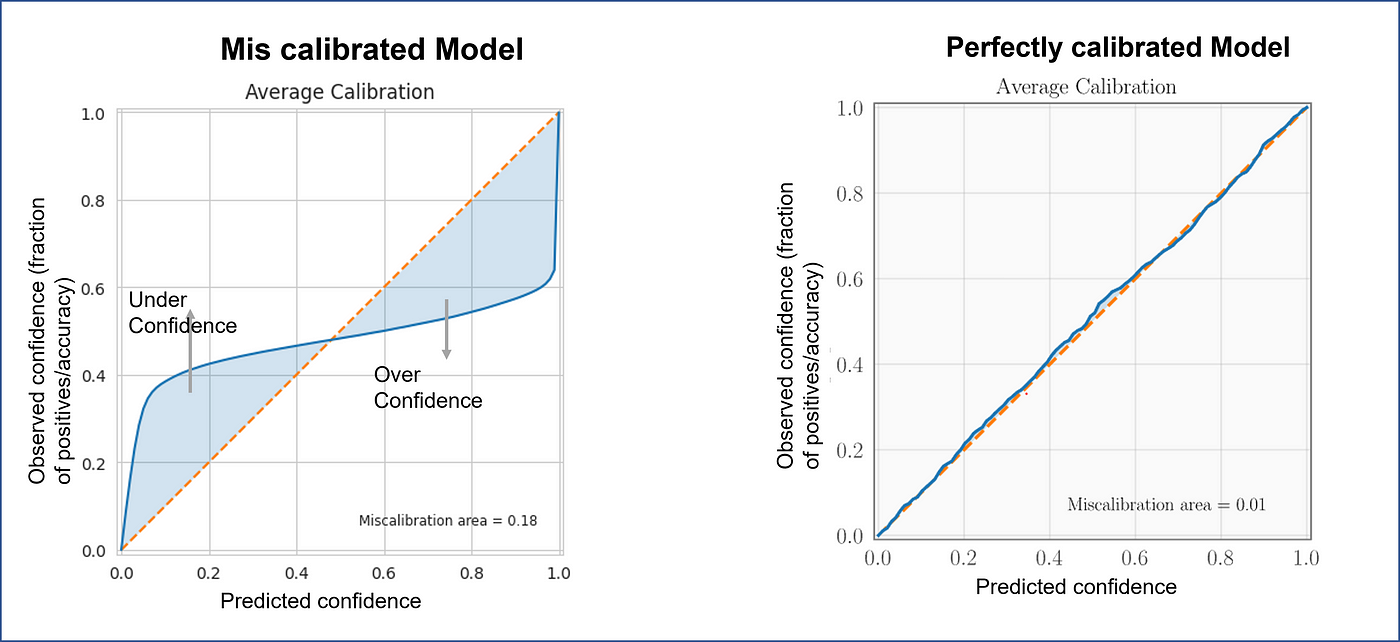
Below is the reliability plot (discussed further section) of an ill-calibrated and well-calibrated model:
Example
Below is the reliability plot (discussed further section) of an ill-calibrated and well-calibrated model:
This means, a model has a lot of false negatives!!
Why is it important?
- Trustworthy predictions – especially in high-stakes areas like healthcare, legal decisions, or autonomous driving.
Why is it important?
Trustworthy predictions – especially in high-stakes areas like healthcare, legal decisions, or autonomous driving.
Better decision-making – when probabilities are used to trigger actions (like alerts or interventions).
Why is it important?
Trustworthy predictions – especially in high-stakes areas like healthcare, legal decisions, or autonomous driving.
Better decision-making – when probabilities are used to trigger actions (like alerts or interventions).
Uncertainty estimation – useful in downstream tasks like ensembling, active learning, or Bayesian inference.
Example
Covid detection model where if the confidence is higher than 90%, the patient is sent to the doctor.
Example
Covid detection model where if the confidence is higher than 90%, the patient is sent to the doctor.
- If the model is overconfident, most of the patients will be sent to doctors, further increasing the workload.
Example
Covid detection model where if the confidence is higher than 90%, the patient is sent to the doctor.
- If the model is overconfident, most of the patients will be sent to doctors, further increasing the workload.
- If the model is underconfident, then there are chances that the COVID-19 patient does not get the required treatment.
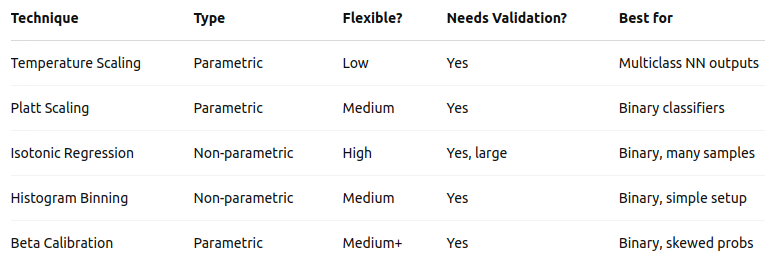
Techniques: Temperature Scaling:
- Used in multiclass neural networks.
- Applies a single scalar temperature to soften logits before softmax.
- T is learned using a validation set to Minimize the Negative Log Likelihood (NLL).
- When T>1, softmax become “softer” (lower confidence). \[\hat{p}_i = \frac{e^{z_i / T}}{\sum_j e^{z_j / T} }\]
Techniques: Platt Scaling or Sigmoid
- Used in binary classifiers (especially SVMs).
- Fit a logistic regression to the model’s logits or scores vs. true labels.
- A and B are learned using a validation set. \[\hat{p} = \frac{1}{1 + e^{(Az+B)}}\]
Techniques: Histogram Binning
- Used in both binary and multiclass classification.
- Bin the predicted probabilities into fixed intervals (e.g., 0–0.1, 0.1–0.2, …).
- Replace each prediction with the empirical accuracy of its bin. \[\text{Calibrated } \hat{p} = \frac{\text{# correct predictions in bin}}{\text{# predictions in bin}}\]
Techniques: Isotonic Regression
- Used in Binary classification with lots of validation data.
- Maps model scores to probabilities using a non-decreasing function.
- Divides the score range into bins, then learns a step function that best fits the true outcomes in each bin. \[\sum_i (y_i - \hat{y}_i)^2\]
Techniques: Beta Calibration
- When Platt Scaling is too simple but you don’t want full non-parametric complexity.
- Fits a Beta distribution-based model to scores.
- Generalizes Platt Scaling using a Beta CDF to better match score distributions.
- Learns parameters a, b, c from validation data. \[\hat{p} = BetaCDF(az +b, c)\]
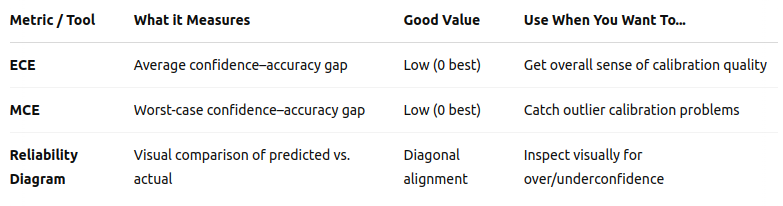
Summary
Metrics
Expected Calibration Error (ECE)
Maximum Calibration Error (MCE)
Reliability Diagrams – plot predicted vs actual probabilities.
Expected Calibration Error (ECE)
ECE measures the average difference between predicted confidence and actual accuracy — across bins of predictions.
Split predictions into M bins, then for each bin B, compute accuracy and confidence: \[ECE=\sum_{i=1}^M \frac{|B_i|}{n} |acc(B_i) - conf(B_i)|\]
Where |B| means the number of samples in the bin B.
A lower ECE means better calibration.
Maximum Calibration Error (MCE)
MCE focuses on the worst-case bin — the maximum difference between confidence and accuracy across all bins. \[MCE = \max_{i=1}^{M} |acc(B_i) - conf(B_i)|\]
Highlights the largest calibration gap.
Useful when you care about any poor calibration, not just the average.
Reliability Diagrams
- A visual tool to plot predicted probability vs. actual accuracy.
Summary